
This article is more than 5 years old.

Moscone Center, site of ALA Annual 2015
This year’s ALA Annual conference took place in a popular destination location, on the weekend following the historic decision from the Supreme Court on the right for same-sex marriage. Add to this that it was the annual Pride parade weekend and there were close to 20,000 librarians in town and you can imagine how high the energy level was in San Francisco! I felt so fortunate that I was able to witness the thousands who came out to celebrate “Love is Love” at Sunday’s parade.

“Love Won” newspaper headline from the San Francisco Chronicle during the Pride Parade
The parade was a highlight, but the conference itself provided plenty of interesting moments as well. This past spring I was elected to a 3-year term as a Director-at-Large for LITA (Library Information and Technology Association). Although I’ve been involved with LITA for many years in a variety of roles, I will be serving on the Board for the next 3 years. So my LITA education began at this conference. I attended the board meetings as a guest and took part in an orientation session to help us new board members get up to speed. I discovered there is quite a bit of background reading to help me learn about the organization, including a manual and the bylaws. I attended LITA’s main program day on Sunday that includes the popular Top Tech Trends panel discussion and the President’s Program, which featured a conversation with Lou Rosenfeld,co-author of Information Architecture for the World Wide Web.
The top trends highlighted by the panel included
- scalable internal connectivity (think about all those mobile devices connecting simultaneously)
- interesting applications for RFID (example – Art Library in Switzerland that uses it for a daily inventory)
- open source software
- free, ubiquitous internet access in cities
- cross-sector collaboration with purpose to improve services
- ILS bloat
- renaissance of podcasting
- innovation communities founded around the library
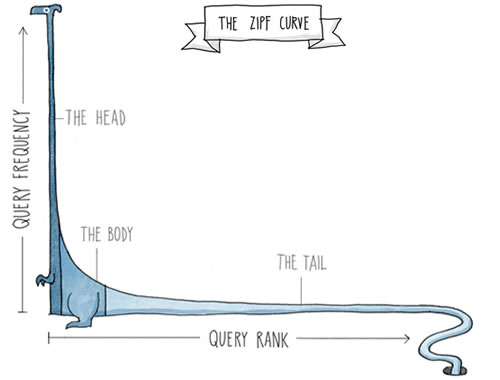
Rosenfeld discussed his work with UX (user experience) and one of the interesting concepts that I learned about was the “short head.” We all know about the “long tail” but not so much about the short head attached to it! This term refers to the figure that is shown on the Zipf curve pictured below (comes from Zipf’s Law). The figure shows the most frequently searched terms on the left, and these make up the “short head.” Rosenfeld uses this curve to demonstrate how to use the law when tuning your website.
With my increased committee involvement, I didn’t have as much time to attend a variety of program sessions, but I managed to select at least one from most of my main areas of responsibility:
Digital Scholarship IG Discussion. I’m certain that Chelcie will give a more granular report for this session, but it was a good program that featured Joan Lippincott from CNI who presented Trends in digital scholarship centers: a view from CNI. She described findings from CNI’s work on trends in digital scholarship centers and her own observations from interviews and on-site visits. One of the main sources of data came from a workshop CNI conducted in April 2014 that involved 35 participants from 24 institutions and resulted in a report published in December. Also presenting were two people from NYU’s Digital Scholarship Services, which has some resemblance to what we are doing at ZSR. They don’t have a specific physical space and pull people in as needed to provide their services.
Creating Impactful Assessment Reports. This program, sponsored by LLAMA, was a panel discussion. The new dean for UNCC, Anne Cooper Moore, was joined by two librarians from Florida State University (Julia Zimmerman, Dean and University Librarian and Kirsten Kinsley, Assessment Librarian). The format of the session was for the panel to field questions relating to leveraging assessment reports to be effective tools to present to stakeholders. Julia noted that most stakeholders are busy people and long reports don’t get read, so she recommended executive summaries as key. Here are some other recommendations:
- Use both qualitative and quantitative data to tell the narrative.
- Individual quotes from people have impact.
- There is a tie between assessment and marketing.
- Data visualizations should be clear, colorful and should stand apart from the text.
An interesting discussion took place about what sort of assessment personnel different libraries have. Many have a single assessment librarian but who that person reports to is all over the map. There was an opinion from the panel that the most effective reporting line is to the library dean. There was also a consensus that having a committee in place either as a stand alone (if there isn’t a designated assessment position) or to supplement the assessment librarian is a good idea. It helps to have more eyes on the data and to get different perspectives.
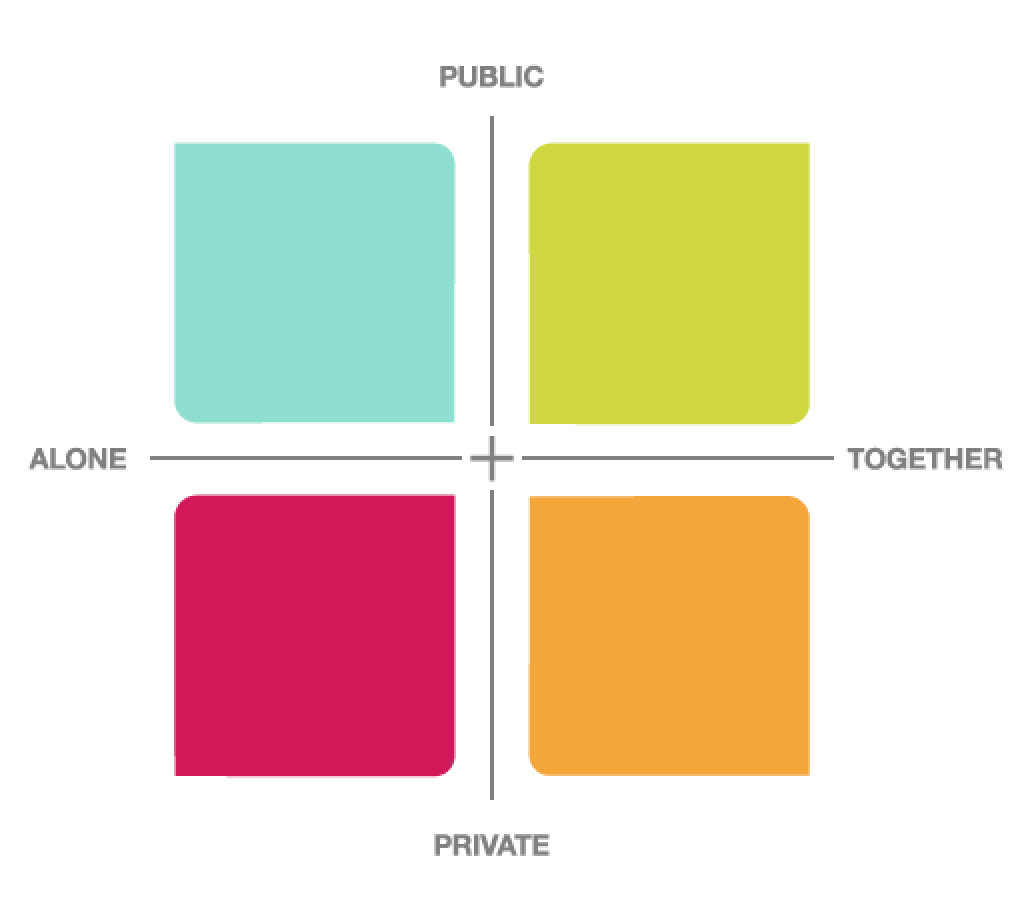
Library of the Future: the Learning Optimized Library. This presentation was given by Steelcase. The speaker, Mark Walters, gave an overview on the company’s research on human behavior in libraries and provided examples of how to design for the tensions that have emerged between learning activities and space design (of course, using their furniture as the examples of solutions! Two new products that caught my interest are the Brody and the Thread). Mark is with the Education division at Steelcase, which launched in 2008. More than once he referenced an article by Scott Bennett on the changing roles of libraries that was published in 2009 (Muse title, restricted to subscribers). He described the methodology of their observational study which included time spent at 20 libraries. They have a living lab at Grand Valley State and this video shows what they’ve done there. The main thrust of their recommendations is to plan in zones with realistic adjacencies that take into account the concept of “alone together” and spanning from private to public:
Findings include:
- Learning is social, but it takes many forms
- Deep thinking requires blocking out distractions (both visual and sound)
- Technology is ubiquitous so there are issues of infrastructure (the whole outlet thing) and ergonomics
- Spaces have different rhythms of behavior
If any of these short narratives have caught your interest, I have more detailed notes I’ll be glad to share. As usual, I’ll close with a link to all the photos I took while I was out and about in San Francisco.
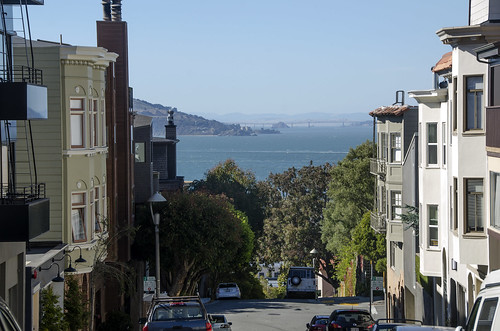
View of Bay Near Coit Tower
2 Comments on ‘Susan at ALA 2015 in San Francisco’
Great coverage. Thanks for sharing.
Susan, I enjoyed learning about the Zipf curve almost as much as I enjoyed your excellent photos from San Francisco! The Brody and Thread would both be great furniture options for our students! It would be fun to test drive both of them! Thanks for posting!